Here’s the image behind this whole site. Progress isn’t slow. It’s a huge river flowing very fast just beneath the surface, and we almost never hear about it.
The snag with an underground river is that you can’t see it. You can stand right on top of it, in a gym or a queue or a bad mood, and feel nothing but solid, unpromising pavement. So I built a window.
Watch a century load
The Loading Bar is a set of progress bars, the kind you stare at while a file downloads, except these are filling with the real world. Drag the slider back to 1900 and only three bars have any data at all, and two of those are under a quarter full. Press Play and watch them fill, year by year, to today. It takes about ten seconds to watch a century load, which is roughly how long most of us give a news story before scrolling on.
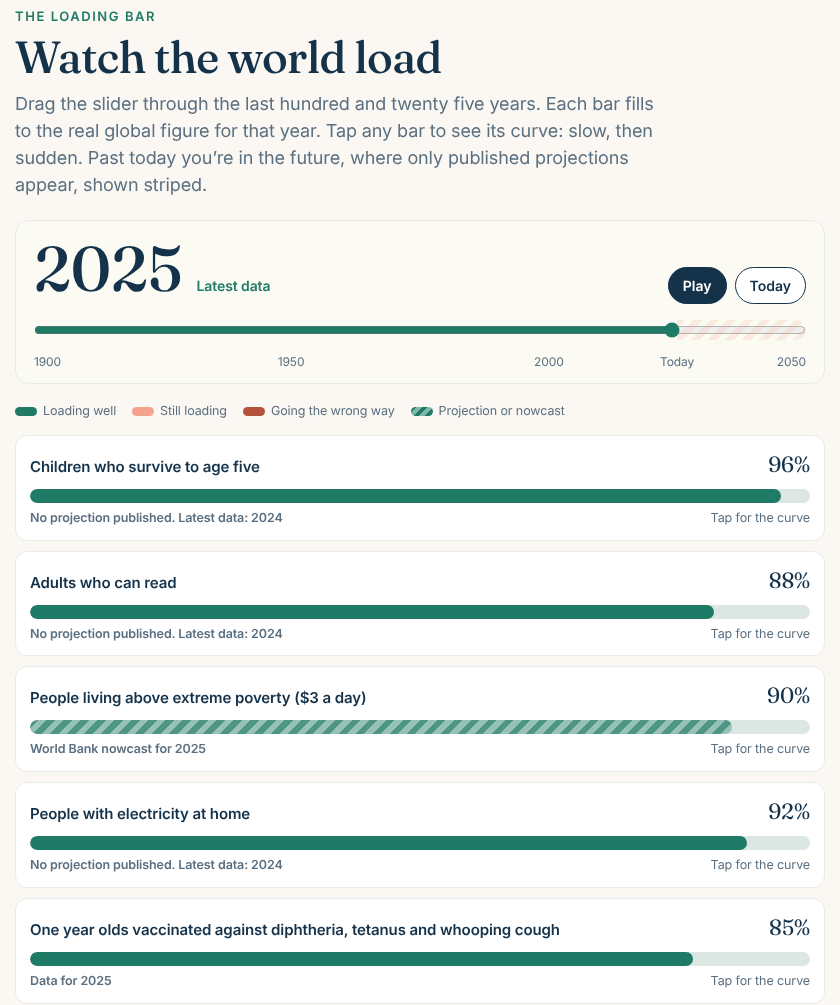
Every bar is a world figure from Our World in Data, traced back to the people who collected it: the UN, the World Bank, WHO and UNICEF, UNESCO, Ember. Tap a bar and you get its whole curve, which is where things get interesting.
Slow, then sudden
Look at solar and wind power. In 2005 they made about 0.6 per cent of the world’s electricity. Ten years later it was 4.5 per cent. In 2025 it was 17 per cent. For years the line hugs the floor and nobody notices, then it turns a corner and heads for the ceiling. That shape, slow and then sudden, turns up again and again in the history of progress, and it’s why change so often seems to come out of nowhere.
Infographic
Then and now
The bars that are still loading
A tool that only cheered would be a poster, not a window. So two of the bars are honest about what’s lagging. Women hold about 27 per cent of seats in parliaments worldwide, up from almost none in 1900 but nowhere near half. And the Living Planet Index, an average of tracked wildlife populations, is at about 27 per cent of its 1970 level and still falling. Those bars are coral, and they’re staying on the page.
Into the future, carefully
Keep dragging past today and the slider carries on to 2050. Out there the bars turn striped, because nobody has data from the future, whatever the internet says. Only projections published by named bodies appear, like the UN’s projection that life expectancy will reach about 77 years by 2050. Where nobody credible has made a projection, the bar simply stops at today and says so.
If it makes your morning a little calmer, send it to one friend who could do with that. That’s really what it’s for.
Optimism is not a prediction. It is a form of service.
The Evidence
Last checked 9th November 2026 · 5 main claims · 5 sources · 0 corrections
Main claims and how sure I am:
- Solar and wind went from about 0.6% (2005) to 4.5% (2015) to 17% (2025) of world electricity. Well established. Ember and others via Our World in Data
- Life expectancy at birth rose from about 46 years (1950) to 73 years (2023); the UN projects about 77 by 2050. Well established (past); Likely (projection). UN World Population Prospects 2024
- Child survival to age five rose from about 75% (1950) to 96% (2024). Well established; 1950 is a reconstruction. UN IGME and Gapminder
- Monitored wildlife populations average about 27% of their 1970 level. Likely; the method is debated. WWF and ZSL
- Progress is a fast river beneath the surface. My idea.
The strongest objection: that world averages hide countries and groups going backwards. True, and a future version will add country views.
What would change my mind: a reversal in the long trends shown, or better data that changes the early estimates.
Sources:
- Our World in Data: solar and wind share
- Our World in Data: life expectancy with UN projections
- Our World in Data: child mortality
- Our World in Data: Living Planet Index
- Our World in Data: literacy
Updates and corrections: none yet. Spotted a problem? Tell me and I’ll fix it, with a dated note here.
Keep going: The Loading Bar · Why the world feels worse than it is · All articles.
Leave a Reply