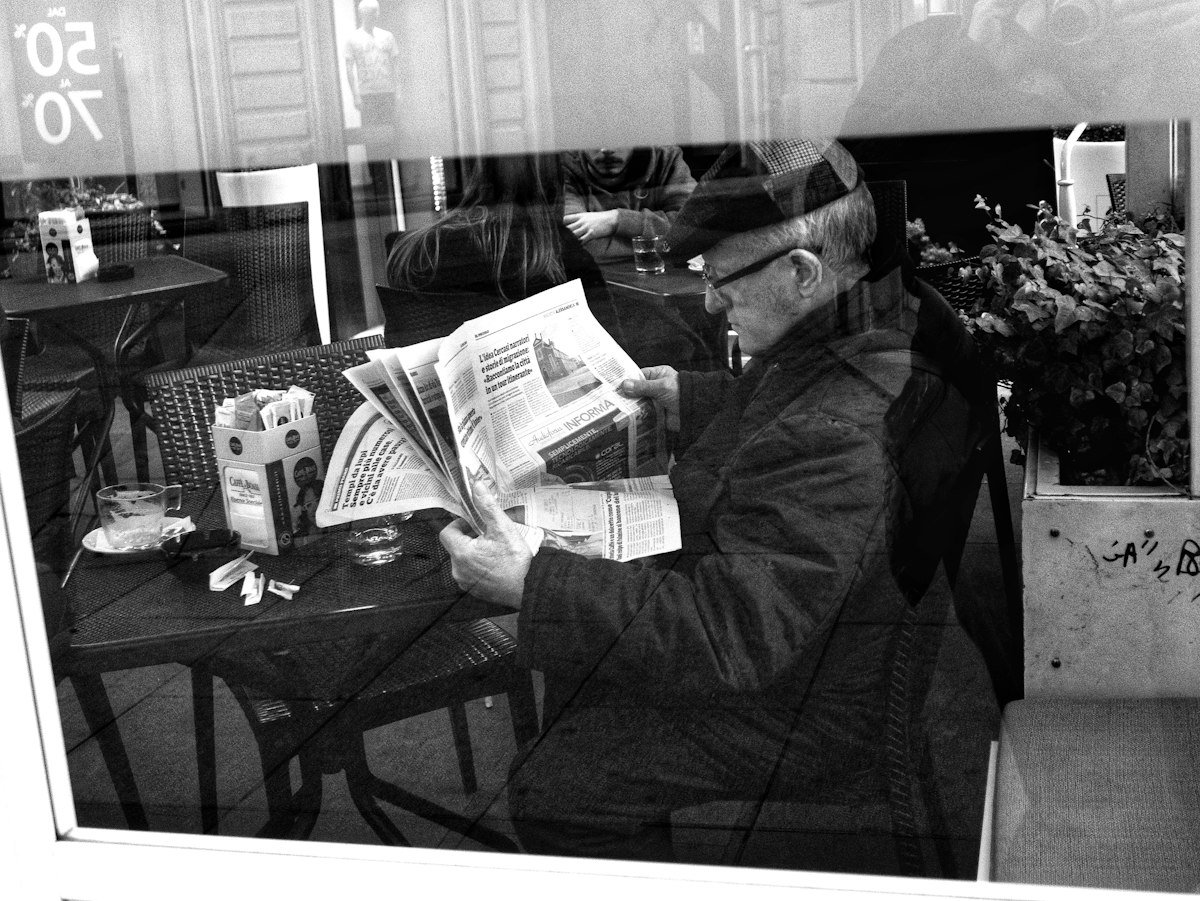
I was on a treadmill when the crane fell over. Not my crane, you understand. It was on the television bolted to the gym wall, somewhere in the north of England, and the presenter had that grave, slightly lowered voice that tells you something significant has happened and you ought to feel something about it.
So I did. I jogged on, going nowhere at a steady pace, and wondered what exactly I was meant to do with the information. I couldn’t fix the crane. I didn’t know anyone near it. As far as I could tell, the only practical use for the news was to carry the same low hum of unease out of the gym and pass it on to someone later, like a chain letter made of bad news.

That afternoon left me with a question I’ve been chewing on ever since. If so much is going right, and the long data says a great deal is, why does almost everyone feel the opposite?
Six optimists in a room of a hundred
The gloom isn’t a fringe view. In March 2020 YouGov asked 3,698 adults in Great Britain whether the world was getting better or worse. Six per cent said better. Seventy per cent said worse. Picture a room of a hundred Britons: you’d find six optimists, and they’d probably be standing near the crisps, keeping their heads down.
Infographic
Is the world getting better or worse?
And the pessimists aren’t foolish. They’re paying attention, which is a virtue. There are wars, the climate is changing, and plenty of people are struggling. If you only had one source of information about the world, and it was the gym television, seventy per cent would look like a generous score for the human race.
But here’s the thing about the gym television. It isn’t lying. The crane really did fall. The trouble is what it leaves out, and why.
The news is a record of the sudden
A crane can collapse in an afternoon. A camera can get there by teatime. Almost everything that’s getting better, though, gets better slowly, quietly and in thousands of places at once, which is about the least filmable thing that can happen to anyone.
Take children. In 1950, about one child in four worldwide died before their fifth birthday. By 2024 it was 3.7 per cent, roughly one in 27. Imagine thirty babies born in the same week. In 1950, seven or eight of them would never have reached a school gate. Today it’s one. That might be the most important change in the history of being a parent, and I don’t believe a presenter has ever lowered his voice to announce that, once again, fewer children died today.
Therefore the news isn’t a picture of the world. It’s a sample of the sudden. And the sudden, on average, is bad, because good things mostly arrive as slow trends while bad things often arrive as events.
Our brains are built for the rustle in the grass
The second reason is us. In 2001 four psychologists, Roy Baumeister and colleagues, reviewed a huge range of studies and gave their paper a title that does the job of a whole book: Bad is Stronger than Good. Across relationships, feedback, memories and first impressions, bad things hit harder and stick longer than good things of the same size.
That made perfect sense for our ancestors. The one who assumed the rustle in the grass was a lion lived to have grandchildren. The one who assumed it was a nice breeze was, briefly, lunch. The problem is that a modern gym, with its wall of screens, is a rustle in the grass on a continuous loop.
And many of us have responded in the most human way possible: we’ve stopped looking. The Reuters Institute Digital News Report 2026 found that 42 per cent of people now sometimes or often avoid the news, up from 29 per cent in 2017. In the UK it’s half of us. So we catch the alarm in passing and miss the context entirely. I don’t think people are tired of facts. I think they’re tired of a particular feeling.
A different instrument
If the news is a camera pointed at the sudden, you need a different instrument to see the slow. That’s the whole idea behind this site. Progress isn’t slow at all, really. It’s a huge river moving fast just beneath the surface. You just can’t see it from a treadmill.
So I built a window into it: The Loading Bar. Drag a slider from 1900 to today and watch child survival, reading, electricity and vaccination fill up in front of you. It takes about ten seconds to watch a century load.
Infographic
A century, loading
What’s still loading
None of this means everything is fine, and I’d be suspicious of anyone who said so. The Living Planet Index suggests the monitored wildlife populations it tracks have shrunk by about 73 per cent on average since 1970. That figure is an average of population trends, not the share of all animals lost, but it’s heading the wrong way. The world can be bad and better at the same time. Most of the time, it is.
The honest sceptic’s question is whether I’m just picking the cheerful charts. It’s a fair one, which is why every article here ends with its evidence laid out, graded and dated, the gloomy numbers included.
Back on the treadmill
I still go to that gym, and the television still talks to me in its lowered voice. I hope everyone was all right near that crane. But I’ve noticed the treadmill is a decent metaphor for the news: you can run on it for an hour and end up exactly where you started. The world, rather inconveniently for headline writers, doesn’t work like that. It keeps moving, mostly forwards, mostly while nobody’s filming.
Optimism is not a prediction. It is a form of service.
The Evidence
Last checked 9th November 2026 · 6 main claims · 6 sources · 0 corrections
Main claims and how sure I am:
- Most people in Britain think the world is getting worse (70% worse, 6% better, March 2020). Well established for that poll; one survey at one moment. YouGov
- Child deaths before age five fell from about 24.7% (1950) to 3.7% (2024) worldwide. Well established; 1950 is a reconstruction. UN IGME and Gapminder via Our World in Data
- Bad events have stronger effects on us than good ones of the same size. Well established. Baumeister and colleagues, 2001
- 42% of people sometimes or often avoid the news, up from 29% in 2017; half in the UK. Well established. Reuters Institute 2026
- Monitored wildlife populations have shrunk by about 73% on average since 1970. Likely; the method is debated. WWF and ZSL via Our World in Data
- News selects for sudden events, so slow improvements rarely appear. My idea, consistent with the evidence above.
The strongest objection: that good long term averages can hide places and people going backwards. They can, which is why the wildlife figure is here and why future articles look at inequality and young people’s wellbeing head on.
What would change my mind: evidence that long term trends in child survival or literacy had reversed globally, or that people’s gloom tracked real conditions closely.
Sources:
- YouGov daily results, 2nd March 2020
- Our World in Data: child mortality
- Baumeister, Bratslavsky, Finkenauer and Vohs (2001), Review of General Psychology
- Reuters Institute Digital News Report 2026
- Our World in Data: Living Planet Index
- Our World in Data: literacy
Updates and corrections: none yet. Spotted a problem? Tell me and I’ll fix it, with a dated note here.
Keep going: The Loading Bar · All articles · Why I write this.
Leave a Reply